


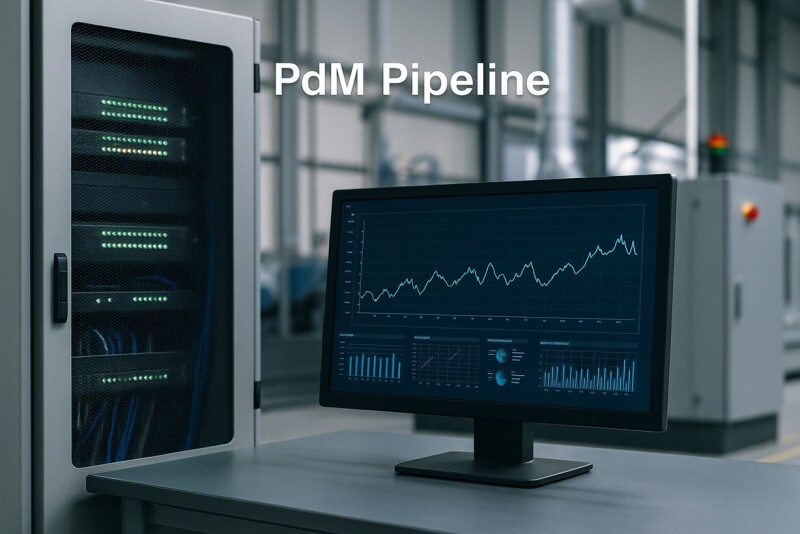
From Historian to Insights: Building a PdM Pipeline with Time-Series Data
Most plants already collect thousands of sensor readings per second—but few extract real predictive insight from them. The key to turning raw historian data into actionable maintenance intelligence lies in building a disciplined predictive maintenance (PdM) pipeline that connects data capture, feature engineering, modeling, and operations in one continuous loop.
Why Historian Data Is a Gold Mine
Industrial historians record process variables—temperature, vibration, pressure, flow, current, and more. They capture years of operational behavior, including both normal and degraded states. Properly cleaned and aligned, these time-series data streams form the foundation for anomaly detection, trend forecasting, and failure prediction.
From Historian to PdM: The Five-Step Pipeline
1. Data Extraction and Contextualization
Historian data alone is just numbers. To make sense of it, link every tag to asset metadata—equipment ID, type, and criticality. Many plants use Asset Frameworks or OPC UA information models for this mapping. The goal is to know which motor, bearing, or compressor each signal belongs to and under what operating conditions it was recorded.
2. Cleaning and Resampling
Historian tags often have irregular timestamps, outliers, or communication gaps. Clean signals by:
- Resampling at fixed intervals (e.g., 1 s or 100 ms) using forward-fill or interpolation.
- Removing spikes and stuck values via median filtering or derivative checks.
- Flagging bad-quality points from the PLC as missing rather than zero.
Consistency here directly affects model accuracy later.
3. Feature Engineering on Time-Series
Transforming raw signals into features bridges OT and data science. For each sensor channel:
- Statistical: mean, RMS, standard deviation, kurtosis, trend slope.
- Frequency: spectral power in key bands for vibration or current.
- Temporal: lagged correlations, rolling-window metrics, seasonality indices.
- Event-based: time since last maintenance or alarm.
Store features in a feature registry with versioning—consistent naming (e.g., vibration_rms_x, temp_slope) ensures models remain portable across sites.
4. Model Training and Validation
Once features are stable, split data into historical periods (train/test) or use rolling windows. Common model types include:
- Regression: Remaining Useful Life (RUL) prediction via XGBoost or LSTM.
- Classification: Healthy vs degraded vs failed states.
- Anomaly detection: Autoencoders or statistical residual analysis.
Validation uses real maintenance outcomes from CMMS tickets. The result: a model with measurable precision, recall, and lead time.
5. Deployment and Feedback Loop
Deployed models run on the edge or near-historian compute nodes for low latency. Predictions and anomalies are pushed back into the historian or CMMS as new tags. This closes the loop—data generates predictions, predictions trigger work orders, and outcomes retrain models automatically.
Integration Patterns
Most modern plants integrate PdM pipelines using:
- OPC UA over TSN for deterministic data transport.
- MQTT Sparkplug B for lightweight, event-driven messaging.
- REST APIs for model and feature registry access.
- Edge gateways that buffer during outages and enforce local retention.
Example Architecture
A metals plant built its PdM pipeline in four layers:
- Sensor & Historian: Siemens PLCs feeding OSIsoft PI and vibration gateways.
- Data Prep: Edge scripts clean and resample tags in real time.
- Analytics: Cloud-based notebooks train anomaly detection models.
- Feedback: Model outputs streamed back as “health indices” to the historian.
Within 6 months, they detected early bearing wear 10 days before failure and reduced unplanned downtime by 25%.
KPIs for PdM Pipelines
- Data latency: Time between signal capture and model inference.
- Feature freshness: Update interval of computed features.
- Model accuracy: Verified via alert validation and MTBF impact.
- Retraining frequency: Average days between model updates.
- Uptime gain: Difference in availability before vs after PdM deployment.
Q&A: Historian Integration Basics
Can I build a PdM pipeline without replacing my historian?
Yes. Most modern historians expose REST or ODBC interfaces. You can extract data periodically or stream deltas using event frames.
Where should models run—edge or cloud?
Edge for low-latency decisions, cloud or data center for training and fleet-wide analysis. Hybrid deployments combine both efficiently.
How much history do I need?
At least one full maintenance cycle per asset type—typically 6–12 months of data for meaningful trend extraction.
Related Articles
- Predictive Maintenance in 2025: Sensors, Signals, and Real ROI
- MLOps for OT: Versioning, Drift, and Model Monitoring on the Edge
- 5 KPIs That Prove Your PdM Program Works (and 3 That Don’t)
Conclusion
Your historian already holds the evidence of every failure and recovery. A proper PdM pipeline transforms that data into foresight—turning trends into alerts, alerts into actions, and actions into proven ROI. By combining reliable edge ingestion, standardized features, and disciplined feedback, manufacturers can finally convert decades of time-series data into continuous reliability improvement.


Interested? Submit your enquiry using the form below:
Only available for registered users. Sign In to your account or register here.